Siena Programs Approved
Programs offered by Siena Heights University approved by the Michigan Department of Education and CAEP. Programs with an * will be sunsetting due to requirements of the Michigan Department of Education. Programs with a ! are in development:
| Early Childhood | Elementary Grades | Middle and High School | K-12 Programs |
| Birth – Kindergarten | PK – 3rd Grade | 5-9 Language Arts | Special Education – Learning Disabilities |
| Early Childhood B.A. Non-Cert | 3rd – 6th Grade | 5-9 Mathematics | Special Education – Cognitive Impairment |
| Early Childhood A.A. | 5-9 Social Studies | Music Education | |
| CDA Credential | 7-12 Language Arts | ||
| 7-12 Mathematics | |||
| 7-12 Social Studies |
How Effective is a Siena Heights Teacher?
Our Candidates know how to teach and know their content.
At Siena Heights University, we believe educator preparation programs should be held to high standards. Our teacher preparation program demonstrates that we prepare teachers who have a positive impact on children’s learning and development. We collect and analyze performance-based data to help us understand the answers to questions such as: What do our candidates know? Do their employers feel they are well-prepared? By analyzing data we are able to document the effectiveness of our programs and continuously improve the way we prepare teachers to meet the needs of students. Guiding these high standards for continuous improvement are the following eight (8) annual reporting measures for accreditation by the Council for the Accreditation of Educator Preparation (CAEP).
What is Measured?
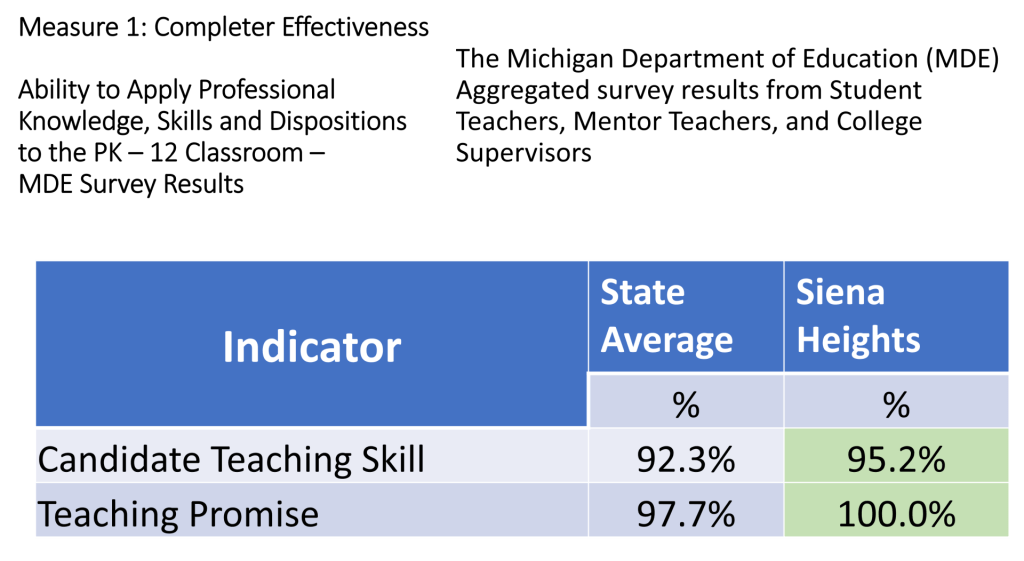
Measure 1: Completer Effectiveness
- •Do completers help PK-12 students learn and succeed?
- •Do completers know what to teach and how to teach?
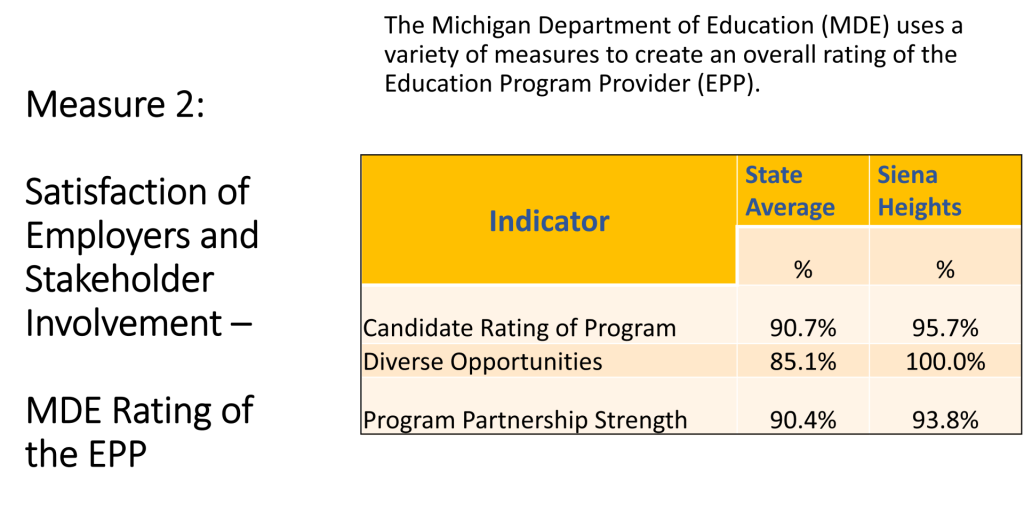
Measure 2: Satisfaction of Stakeholders and Stakeholder Involvement
- •Are employers satisfied with the work of program graduates?
- •Are program stakeholders informed and/or involved with program decisions?
- •Do programs make positive contributions to PK-12 schools?
Measure 3: Candidate Competency at Completion
- •Are candidates competent in subject material?
- •Do candidates have the necessary dispositions to be effective teachers?
Measure 4: Ability of Candidates to be Hired
- •Are candidates hired in the field for which they are prepared?
- •Are new (1-3 year) teachers effective?
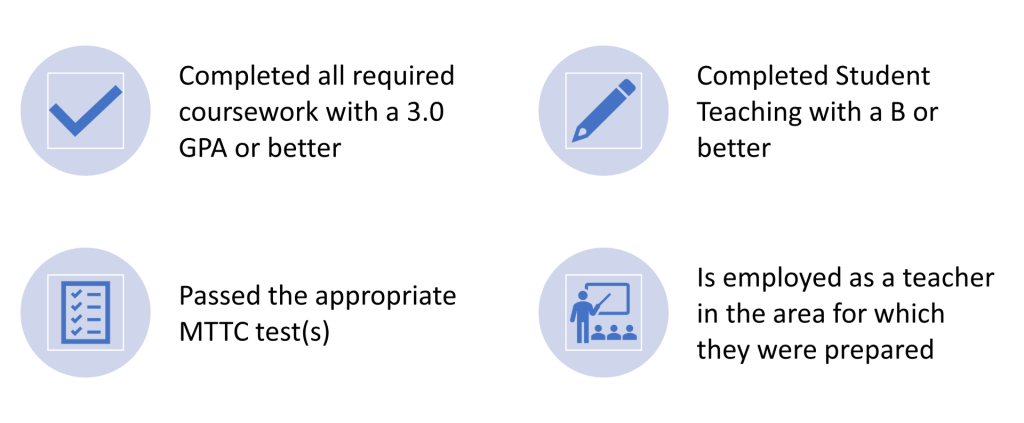
Who Qualifies as a Completer?
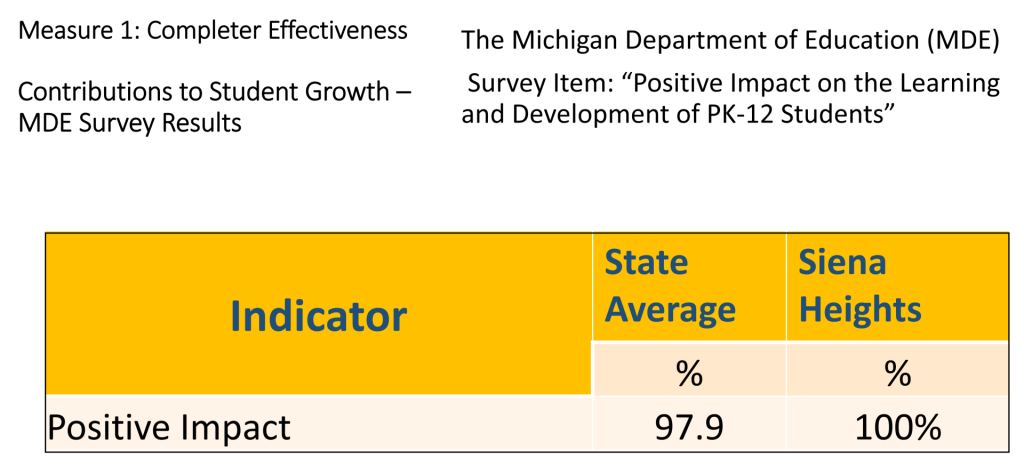
Measure 1: Completer Effectiveness
1. Impact on P-12 Learning and Development
The Michigan Department of Education (MDE)’s surveys of cooperating teachers for all student teachers specifically asks this question: “During the experience, my K-12 school collaborated with the college/university’s preparation program to positively impact the learning and development of K-12 students in my classroom.” Cooperating teachers indicate that indeed Siena Heights’ candidates positively impact the learning and development of their students.
| Years | Cooperating Teacher (n) | Score of Strongly Agree |
| 2016-20 | 31 | 97% |
Beginning with surveys in 2020-21, the above question was replaced with these questions which equate to the same result: To what extend did the candidate:
- connect learning experiences to a variety of backgrounds
- support all students’ socioemotional development?
- communicate effectively with families/caregivers to promote individual student growth?
- build respectful relationships with every student?
- recognize individuals’ potential as demonstrated by setting high expectations for each student?
100% of mentor teachers ranked Siena Heights University Candidate as “To a Great Extent” and “To a Moderate Extent” thus demonstrating the “positive impact on the learning and development of their students.”
2021-2022 Survey Results
Completers’ P-12 Student Growth Data
As another measure of how EPP graduates are performing in their teaching assignments during their first three years in public schools, the EPP initiated a pilot study in 2017-18 to look more deeply at a sample of graduates’ actual student achievement data used in their evaluations. The sample included elementary, middle/high school (secondary), and special education teachers. (See also indicators of teaching effectiveness below.)
2016-17 Summary
| Teacher, grade level | Student Growth Instrument | Results |
| 4th grade | DRA (reading running record) Fall to Winter | Fall average = 34.43, N=23 Winter average = 37.78, N=18 |
| NWEA Reading RIT | Fall average = 198.4, N=24, target=198.2 Winter average = 206.2, N=23, target=203.6 | |
| NWEA Math RIT | Fall average = 206.9, N=23, target=201.9 Winter average = 212.1, N=23, target=208.7 | |
| 3rd grade | Fountas & Pinnell Fall to Spring, N=19 | At grade level Fall: 12/19 (63%) At grade level Spring: 14/19 (74%) 100% made growth; 78% made expected growth |
| MAP: Reading 2-5 RIT | Fall mean = 198.1, N=20, Norm grade level mean = 198.2 Spring mean = 210.4, N=19, Norm grade level mean = 205.9 | |
| 2nd grade | Fountas & Pinnell Fall to Spring, N=25 | Students at grade level expectation: 23/24 (95.8%) Students who made growth: 24/24 (100%) |
| Pearson Realize Diagnostic Test | Fall average = 28.32, N=25 Spring average = 51.12, N=24 Students who made growth: 24/24 (100%) | |
| Math 6th and 7th grades | NWEA Math RIT, 6th grade | Fall average = 215.3, N=83, target=217.6 Spring average = 222.0, N=87, target 225.3 |
| MWEA Math RIT, 7th grade | Fall average = 221.8, N=42, target=222.6 Spring average = 227.5, N=44, target=228.6 | |
| High school special education | Teacher-created Pre/Post Test | Pre-test average = 30% Post-test average = 70% |
For the pilot study, five teachers who are graduates of Siena Heights University submitted student achievement data from their annual evaluation. Regardless of their grade level (2nd grade, 3rd grade, 4th grade, 6th/7th grade, high school) or content area tested, every teacher recognized improved average scores on every student growth instrument. As indicated in the table above, results generally exceeded the target outcome and/or grade level mean. Despite the small sample size, this growth reflects the teachers’ understanding of content, employment of effective teaching techniques, analysis of formal and informal assessment data, and attention to ongoing reflection and adjustment as practiced during their education preparation program.
Similar data will be collected and analyzed each year to monitor how graduates are impacting P-12 student learning. Within the next two years, participating teachers will be asked to survey their P-12 students to collect additional data on their impact.
Due to the Covid 19 and resulting lack of testing, data was not updated for the 2019-2020 year. As a result of subsequent turnover and testing changes, the study was discontinued.
Measure 2: Satisfaction of Employers and Stakeholder Involvement
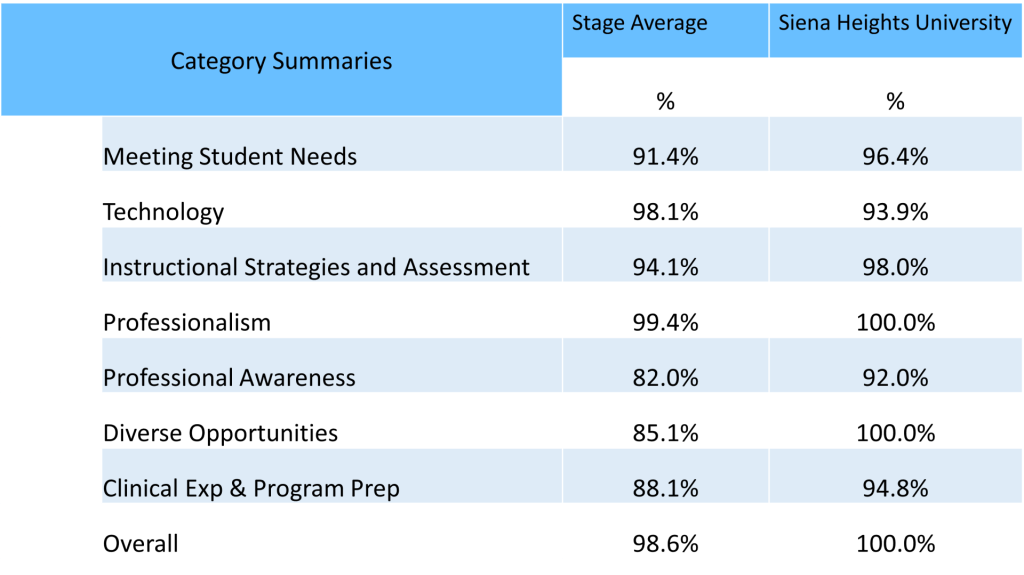
Full Report from the Michigan Department of Education for the 2021-2022 Educator Effectiveness Rating (Reported in 2023)
Indicators of Teaching Effectiveness
Siena Heights’ graduates in their first three years of teaching rate above the state average on teaching effectiveness. In the 2014-16 and 2018-22, 100% of the graduates were rated effective or highly effective. In 2016-17, 97% (34/35) graduates were rated effective or highly effective. (See also the above, case study of completer P-12 student growth data for teaching effectiveness.)
| Year | Number | Effective or Highly Effective | Minimally Effective or Ineffective |
| 2014-15 | 23 | 100% | 0 |
| 2015-16 | 33 | 100% | 0 |
| 2016-17 | 35 | 97% (34/35) | 1 |
| 2017-18 | 35 | 94 (33/35) | 2 |
| 2018-19 | 35 | 100% | 0 |
| 2019-20 | 31 | 100% | 0 |
| 2020-2021 | 20 | 100% | 0 |
| 2021-2022 | 19 | 100% | 0 |
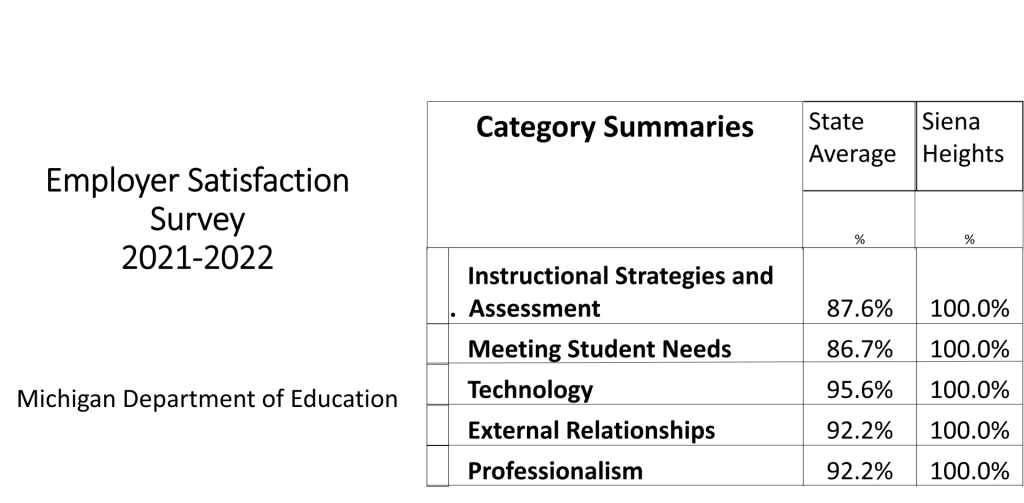
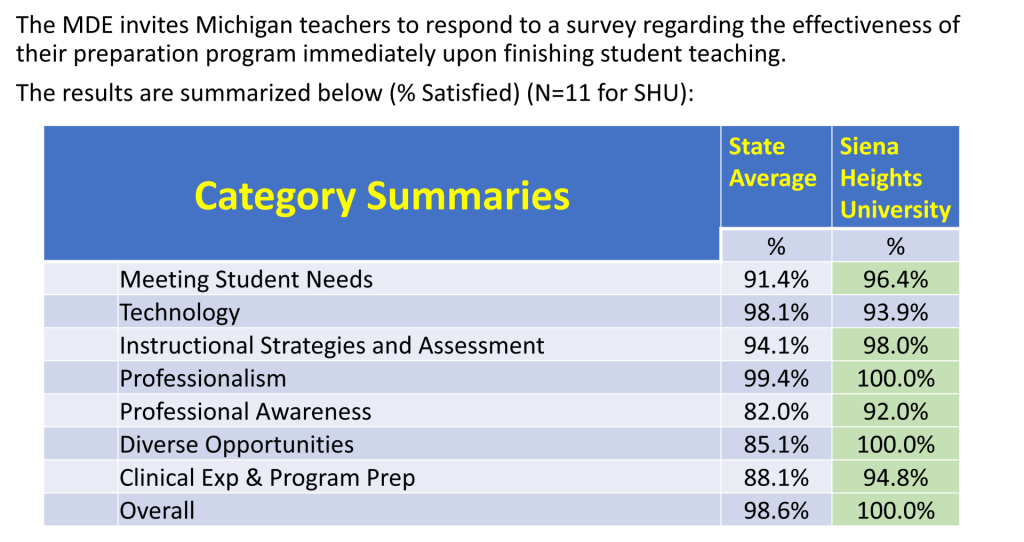
Satisfaction of Employers
Potential employers of Siena Heights University candidates (building principals where our teacher candidates worked) along with the cooperating teachers for each teacher candidate, provide feedback to the Teacher Education Program on how our teacher candidates perform in 14 areas. These components are part of what potential employers assess when hiring teachers. The table that follows shows the average score for each component based on a four-point scale with four being a strongly agree and one being a strongly disagree. The reporting of components by the Michigan Department of Education changes as the MDE refines their survey process. Below are the results from the 2021-22 surveys:
Our teacher candidates show mastery in each of these components:
Based on the Michigan Department of Education survey responses, Cooperating Teachers indicate 100% efficiency in candidate quality.
MACTE statewide principal survey to collect additional data. Survey results will be ready within one-two years.
Stakeholder Involvement – Stakeholder Meetings

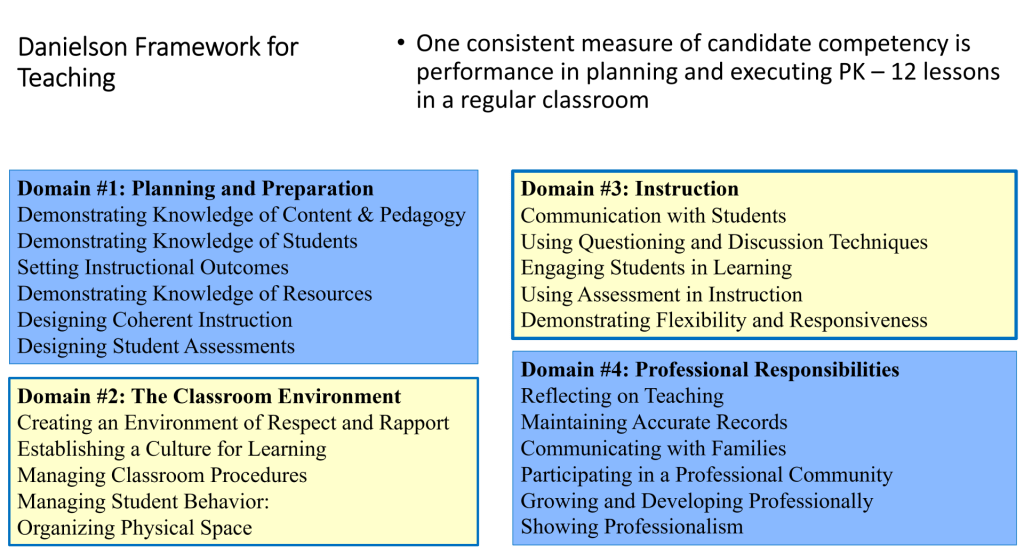
Measure 3: Candidate Competency at Completion
Candidates are assessed as competent in three areas: Teaching, using the Danielson Framework for Teaching; Dispositions, using an instrument created by Siena Faculty; and Content Area Knowledge, using a combination of GPA, Completion Rates, and MTTC test results. These results are discussed below.
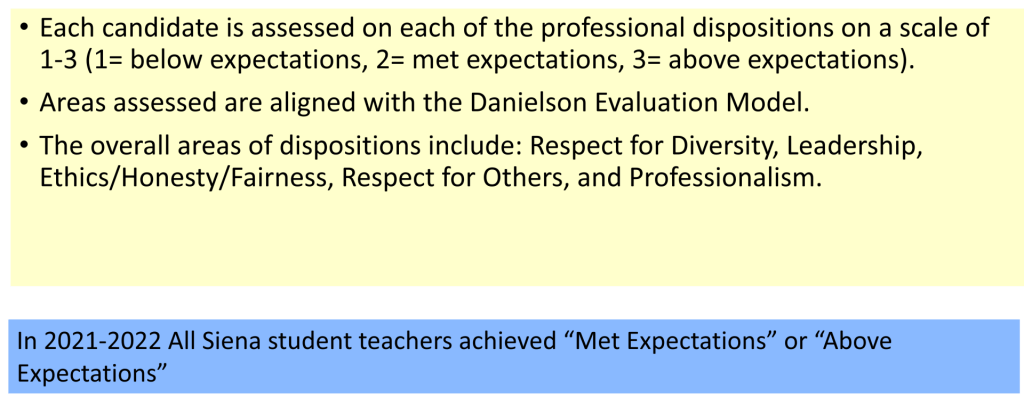
2021-2022 – All Completers were rated as “Meets” or “Exceeds” the standard
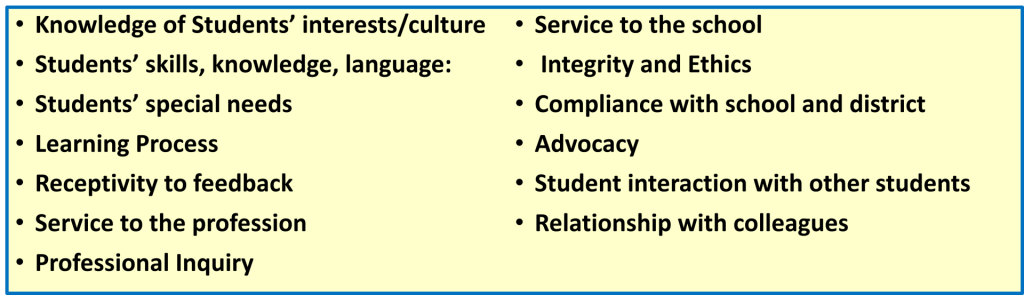
Dispositions
The Dispositions instrument was created by Siena Heights University Education Division Faculty. This instrument is used each semester by the students to self-assess, by college supervisors to assess progress, and by mentor teachers to record field placement observations. The components of the Dispositions instrument are provided below:
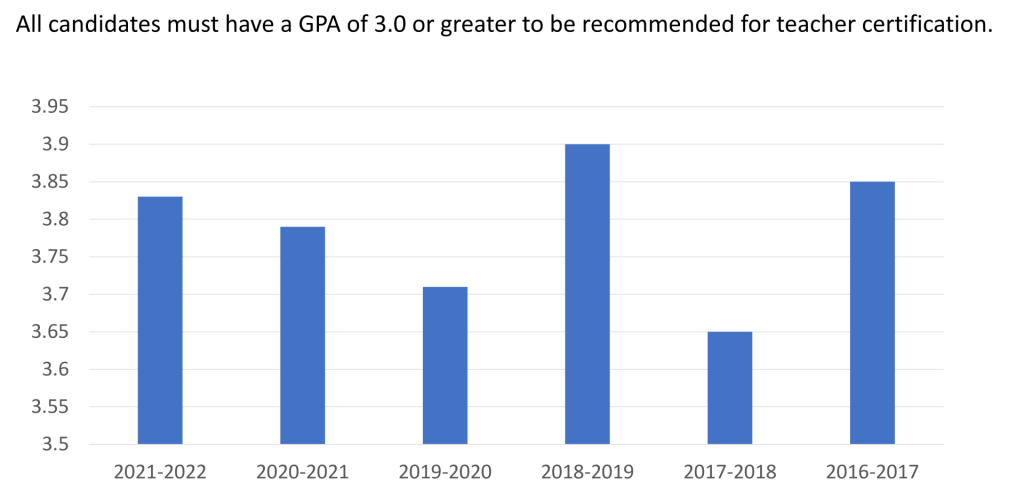
Average GPA of Completers:
| Year | Average GPA | n= number |
| 2016-17 | 3.85 | 9 |
| 2017-18 | 3.65 | 16 |
| 2018-19 | 3.9 | 6 |
| 2019-20 | 3.71 | 8 |
| 2020-21 | 3.79 | 19 |
| 2021-22 | 3.83 | 11 |
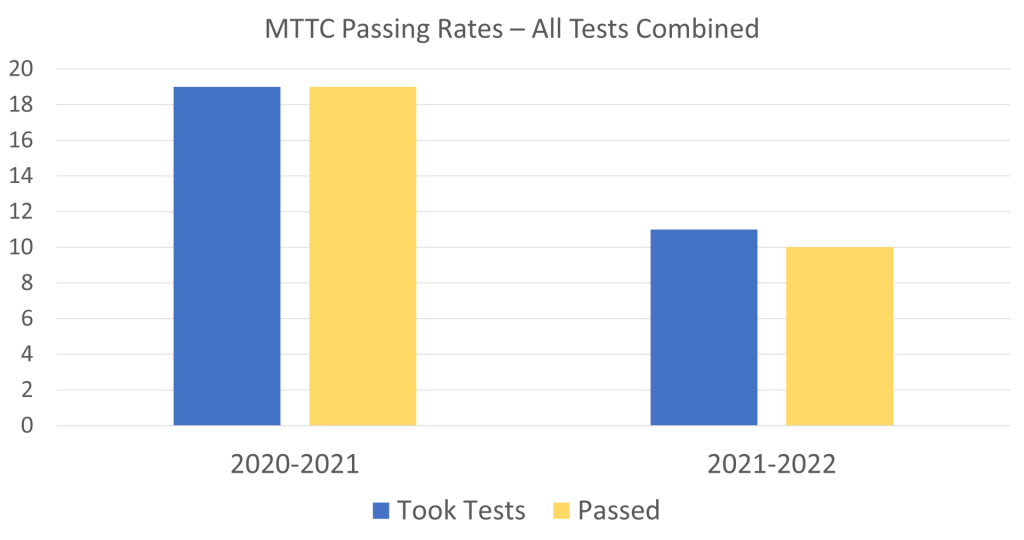
MTTC Passing Rates
Candidates in Michigan are required to pass the MTTC test in their area of preparation. Candidates may take the test when they have completed a majority of their coursework. They may also wait until they have completed student teaching. Passage of the MTTC test indicates sufficient understanding of content and pedagogy to be successful in a PK-12 classroom.
Completer/Graduation Rates
The following table shows Program Completers by Program Area (from Title II annual reports of teachers prepared by subject areas. In some years, counts include individuals who completed programs in more than one area. Note: Due to Covid 19, many candidates who would have normally completed in 2020 were not able to take their MTTC Content Area Tests and are listed as completers in the 2020-2021 year
| Program Area: | 2015-16 | 2016-17 | 2017-18 | 2018-19 | 2019-20 | 2020-21 | 2021-2022 |
| Elementary Education | 15 | 5 | 11 | 4 | 3 | 16 | 4 |
| Early Childhood Education | — | 2 | 4 | — | — | 7 | — |
| Special Education | — | 5 | 4 | — | — | 5 | 3 |
| Physical Education | — | 1 | 2 | — | — | — | — |
| Music Education | — | 2 | 1 | — | 4 | — | 2 |
| English | — | 1 | — | 1 | — | — | 1 |
| Social Studies | 3 | 1 | 1 | — | — | — | — |
| Mathematics | 1 | — | 1 | 2 | 1 | 1 | — |
| English/Language Arts | — | — | 3 | — | 1 | 6 | — |
| Biology | — | — | — | — | — | — | — |
| Spanish | — | — | — | 1 | — | — | — |
| Chemistry | — | — | — | — | — | — | — |
Measure 4: Ability of Teachers to be Hired for the Position for Which They were Prepared
Satisfaction of Completers
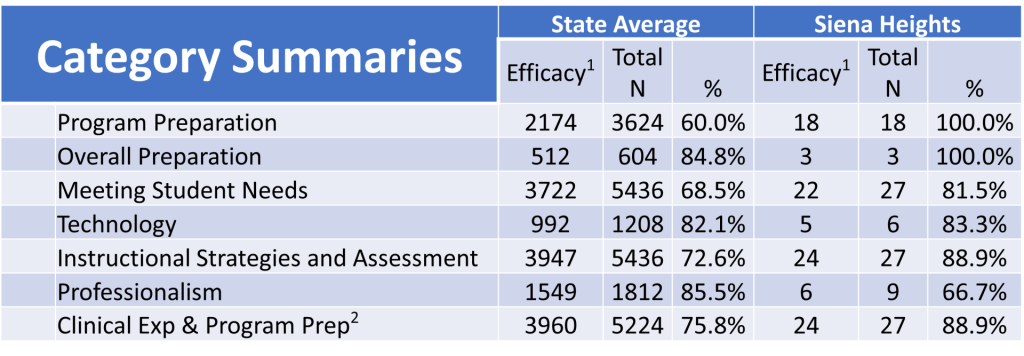
Michigan Department of Education (MDE) surveys graduates one year after graduation. The surveys of Siena Heights’ graduates one-year out, indicate very high levels of satisfaction with their preparation to be successful and effective teachers averaging 97-100% efficacy.
Efficacy Scores (percent) by Strand from MDE Year-Out Surveys
| MDE Survey Data (2015-20) | One-Year Out | |
| N=15 (% Responding to question) | ||
| High Quality Learning Experiences | 3.7 | 80 |
| Addressing the Needs of Special Populations | 3.6 | 80 |
| Organizing the Learning Environment | 3.7 | 80 |
| Using technology to Maximize Student Learning | 3.6 | 80 |
| Effective use of Assessments & Data | 3.5 | 80 |
| Field Experience | 3.8 | 80 |
| MDE Survey Data (2015-19) | One-Year Out | |
| N=9 | ||
| Critical Thinking | 3.5 | 100 |
| Connecting Real World Programs & Local/ Global Issues | 3.4 | 100 |
| Laws, Policies, State Testing | N/A | N/A |
| PK-12 School & University Partnership | 3.7 (2015-18) | N/A for 2017-18 |
Teacher Candidate Satisfaction – 2021-2022
While Siena Heights University is both small and produces a small number of teachers comparative to many of the other Education Preparation Programs in the state, year-out survey data confirms that graduates are consistently satisfied with their education program and feel prepared for their job search and classroom responsibilities. With a total of nine survey respondents from the 2015-16, 2016-17, 2017-18, 2018-19, and 2019-2020 school years, 87% of the respondents indicated they either strongly agreed or somewhat agreed with all 38 of the questions/prompts.
SHU Division of Education faculty analyzes the year-out survey data as well as data from teacher candidates, candidate supervisors, cooperating teachers, and course evaluations each year to inform and revise the education program. This analysis of assessment data, reflection, and commitment to continuous improvement both strengthens the EPP and serves as a model of good practice for SHU teacher candidates.
Ability of Completers to Meet Licensing (Certification) and Any Additional State Requirements
Our Candidates know their content. The average GPA of completers.
| Year | Average GPA | n= number |
| 2016-17 | 3.85 | 9 |
| 2017-18 | 3.65 | 16 |
| 2018-19 | 3.9 | 6 |
| 2019-20 | 3.71 | 8 |
| 2020-21 | 3.79 | 19 |
| 2021-22 | 3.83 | 11 |
Siena Heights University candidates average consistently above the required 3.0 GPA. Over a three-year period, candidates are averaging between a 3.65–3.9 by graduation.
Michigan Test for Teacher Certification, August 2019 – July 2022
Over this three-year period, the overall passage rate for all test-takers on the Michigan Test for Teacher Certification was 85%. The following table dis-aggregates the data by test:
** Number of test takers < 5; — means the state did not have enough test takers to create a %
| Program | N | SHU Pass Rate (%) | State Pass Rate (%) |
| English (002) | 6 | 68 | 86.3 |
| History (009) | 2 | 50 | 67.7 |
| Biology (017) | 0 | N/A | 81.7 |
| Chemistry (018) | 0 | N/A | 82.9 |
| Mathematics (Sec) (022) | 1** | 100 | 85.6 |
| Spanish (028) | 0** | N/A | 89.9 |
| Physical Education (044) | 1** | 100 | 80 |
| School Counselor (051) | 0 | N/A | 96.5 |
| Cognitive Impairment (056) | 14 | 86 | 86.7 |
| Learning Disabilities (063) | 0 | N/A | 89.1 |
| Learning Disabilities (114) | 5** | 100 | 95.6 |
| Social Studies (Sec) (084) | 5 | 100 | 83.8 |
| Mathematics (Elementary) (089) | 0 | N/A | 86.1 |
| Language Arts (Elementary) (090) | 9 | 56 | 81.4 |
| Reading Specialist (092) | 2 | 100 | 93.2 |
| Music Education (099) | 16 | 83 | 97.4 |
| Elementary Education (103) | 39 | 90 | 83.4 |
| Social Studies (Elementary) (105) | 1** | 0 | 73 |
| Early Childhood Education (General and Special Education) (106) | 3 | 67 | 75.4 |
Year Out Survey
For employed graduates completing the 2015-22 Year Out Surveys for the Michigan Department of Education, indicated that the program prepared them well for the teaching job market, supported them in their job search, the university holds a positive reputation among prospective employers, and the university provided good advice on job placement opportunities. Siena Heights also prepares teachers in high needs fields (special education, early childhood education, mathematics, science, and reading) so completers have excellent job prospects upon graduation.
| Year-Out Survey Categories: The program prepared them well for the teaching job market, supported them in their job search, holds a positive reputation among prospective employers, and provided good advice on job placement opportunities | % Efficacy (on the survey questions) |
| 2015-16 | 100% |
| 2016-17 | 100% |
| 2017-18 | 100% |
| 2018-19 | 88% |
| 2019-20 | 88% |
| 2020-21 | 72.5% |
| 2021-22 | 85% |
2021-2022 Year Out Survey Information Dis-aggregated